CSV to Geochart - Google Visualization Chart WordPress Tutorial
In this tutorial we will parse a CSV file, containing random countries, with their own colour and tooltips displaying both the country and it’s continent. The CSV file will be converted to JSON dynamically and added to a Google Visualization Geochart in your WordPress Blog.
 Image provided by Shutterstock
Prerequisites
Access to your WordPress theme folder. Knowledge of PHP, JavaScript and WordPress functions is useful but not required. The CSV file can either be self-hosted or from Google Drive providing that you publish the file as a CSV and that you place it in a shared folder.
Download
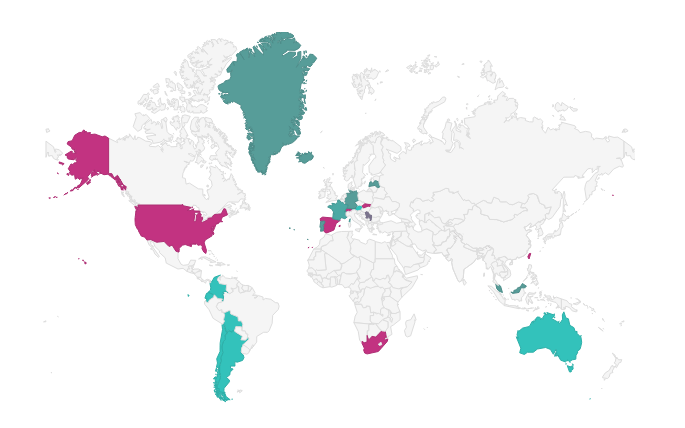
The demo CSV file can be accessed from Google Drive. The final outcome of the Geochart will look like this.
Let’s get Started
In the Download, among the source files, there is an example of the CSV file which we will use to create our geochart. Upload the js and data folders to your WordPress theme folder. If using a Child Theme upload to that folder and not the parent.
Ajax in the Head
Before we start to enable our ajax event to fire when non-admin users look at the page. Open up header.php and check to see if ajaxurl is defined. If not add the following just above the wp_head() function.
<?php if (!is_admin()){?>;

<script type="text/javascript">
var ajaxurl = "<?php echo admin_url('admin-ajax.php'); ?>";
</script>

<?php }?>
Add the Chart Container to the Blog Post/Page
<div id="regions_div"></div>Enqueue The JavaScript and Hook in our Ajax Actions
To add the JavaScript to our WordPress blog we need to officially enqueue our scripts so that they are present for the chart to load. Open up functions.php and add the following and save but don’t close. Please note that if you are not using a child theme change all instances of
get_stylesheet_directory_uri()
with
get_template_directory_uri()
//Enqueue our JS

function map_chart(){
//if (is_page('page_name')){ Highly recommend limiting to post (is_post) or page(is_page)
wp_enqueue_script('chart', 'https://www.google.com/jsapi');
wp_enqueue_script('chart_main', get_stylesheet_directory_uri(). ' /js/chart-map.js', array('jquery'));

//}
}
add_action( 'wp_enqueue_scripts', 'map_chart' );
add_action( 'wp_ajax_build_map', 'build_map' );//admin action
add_action('wp_ajax_nopriv_build_map', 'build_map');//frontend action
The Google Visualization library is quite heavy and unnecessary to load on every page or post. Simply un-comment Lines 5 & 9 to only load the JavaScript on a specific page, replacing page_name with the Page ID, Page Title or Page Slug. If you are displaying your chart in a blog post replace is_page() with is_single() See is_page() and is_single() on the WP Codex for further details.
Fetch the CSV Data
Whilst functions.php is still open we are now going to add the code snippets to fetch the data from the CSV file either in the data folder or directly from Google Drive.
/*
-
- Function get_csv()
-     1. default - parse local CSV file (data folder)
-
-     2. or fetch URL of the GDrive document providing that it is in a shared folder and is published to the web as a CSV
-
- @return json encoded data
*/

function get_csv(){

//Get the CSV file - default or replace with your GDrive URL
$url = get_stylesheet_directory_uri().'/data/map_data.csv';

//$url= 'https://docs.google.com/spreadsheets/output=csv';

// Request the data from the CSV file
$request =   wp_safe_remote_get($url);
$response = wp_remote_retrieve_body( $request );

//Convert the data to an array
$data = array_map("str_getcsv", explode("n", $response));

//Count how many rows
$count = count($data);

//Use first row for names
$labels = array_shift($data);

//Use labels as keys
foreach ($labels as $label) {
  $keys[] = $label;
}
//create array with key[id]/value of count -1 as we shifted top row for headers
    for ($i = 0; $i < $count-1; $i++) {
        $idVal[]  = $i;//values
        $idKey[] = 'id';//key
        $id_array[] = array_combine($idKey,$idVal);//combine both
}

//combine the labels key with the existing data
foreach($data as $d) {
        $newArray[] = array_combine($keys, $d);
}
//Merge both arrays together
foreach($newArray as $key => $value){
    $result[$key] = array_merge($id_array[$key], $newArray[$key]);
}
//uses built-in wp_json_encode to decode data and return the result
return wp_json_encode($result);

}

/*Function build_map is fetched by the JavaScript Ajax request and uses the get_csv() function*/
function build_map(){
$data = get_csv();// gets the CSV data
echo $data;
die();
}
Lines 19-20 – Requests the CSV file from the URL variable that is specified. If the file is on the server then the CSV file should be a relative link and if using Google Drive the URL will be absolute.
Line 23 – This parses the CSV file as a string and maps it to an array.
Line 26 – Counts how many rows are in the array.
Line 29 – Strips the first row as headers to be used as keys in the array (Lines-32-34).
Lines 36-40 – Creates an id array with the total count. These are used to map the colours to the right country in the JavaScript.
Lines 43-45 – This combines the rest of the data with the labels.
Lines 46-49 – Merge both arrays together to create 1 associative array.
Line 51 – Converts and returns the JSON when the JavaScript executes the Build Map Ajax function (Lines-58-62).
Chart-map.js JavaScript
The JavaScript files pulls everything together and options can be changed to suit your own preferences.
var $j = jQuery;
var mapColor;

// Load the Visualization API and the chart package.
google.load("visualization", "1", {
  packages: ["geochart"],
});

// Set a callback to run when the Google Visualization API is loaded.
google.setOnLoadCallback(drawRegionsMap);

//Create our Chart through an Ajax request by passing the build_map action which will be parsed with the build_map function in functions.php

function drawRegionsMap() {
  $j.ajax({
    url: ajaxurl,
    data: {
      action: "build_map", //run build_map function in functions.php
    },
    dataType: "json",
  }).done(function (csv) {
    var data = new google.visualization.DataTable();
    data.addColumn("string", "Country");
    data.addColumn("number", "id"); // The id associates the color field
    data.addColumn({
      type: "string",
      role: "tooltip",
    });
    mapColor = []; //array to hold all the colours from the CSV file

    $j.each(csv, function (i, item) {
      //jquery each function

      data.addRows([
        [
          {
            v: this.countryCode,
            f: this.tooltipTitle,
          },
          this.id,
          this.tooltipText,
        ],
      ]);

      mapColor[i] = item.Color; //add each color item to the array - accessed in options below
    });
    var countColors = mapColor.length; //counts the colours - accessed in options below

    var options = {
      backgroundColor: {
        fill: "#FFFFFF",
        stroke: "#FFFFFF",
        strokeWidth: 0,
      },
      colorAxis: {
        minValue: 0,
        maxValue: countColors,
        colors: mapColor,
      },
      legend: "none",
      datalessRegionColor: "#f5f5f5",
      displayMode: "regions",
      enableRegionInteractivity: "true",
      resolution: "countries",
      sizeAxis: {
        minValue: 1,
        maxValue: 1,
        minSize: 10,
        maxSize: 10,
      },
      region: "world",
      keepAspectRatio: true,
      width: 600,
      height: 400,
      tooltip: {
        textStyle: {
          color: "#444444",
        },
        trigger: "focus",
      },
    };

    var chart = new google.visualization.GeoChart(
      document.getElementById("regions_div"),
    );

    chart.draw(data, options);
  });
}
Line 16 – This is the start of the Ajax Request to build map in functions.php. As it returns the dataType JSON there is no need to decode it.
Line 22 – Once the Ajax request is complete we start to build the chart.
Lines 24-29 – Creates the Columns to hold our rows
Lines 32-42 – Using jQuery’s each function we add the rows to match the columns. Line 40 represents the colours from the CSV file to be used to colour the individual countries dynamically in the options.
Line 43 – Counts how many colours, there are, which is added to max value in options. This ensures that each country has a corresponding colour.
Conclusion
I hope that you have enjoyed this tutorial. If you come across any errors or have any suggestions how to improve it further then please don’t hesitate to get in touch.