Adding Google Charts to WordPress Blog Part 1
In this mini-series of Google Visualization tutorials, we will be adding a Google chart table to a WordPress theme without having to install any plugins but ensuring that we use the correct WordPress functions and recommended a safe way of implementing JavaScript. The data we will be pulling will be in JSON format and will be stored on the same server inside the theme directory. In this tutorial, we will be adding a table. Want to add a chart? Check out part 2
 Image provided by Shutterstock
Prerequisites
Access to your WordPress theme folder. A little knowledge of PHP and WordPress functions is useful but not required.
Download
Download Google Visualization Table
Let’s get started
In the Download above there is an example of a correctly formatted JSON file (Purely fictional of course) which we will use to populate our data to create our table. Upload the js and data folder to your WordPress theme folder. If using a Child Theme upload to that folder rather than the parent.
Ajax in the head
Before we start to enable our ajax event to fire when non-admin users look at the page. Open up header.php and check to see if ajaxurl is defined. If not add the following just above the wp_head() function.
<?php if (!is_admin()){?>

<script type="text/javascript">
var ajaxurl = "<?php echo admin_url('admin-ajax.php'); ?>";
</script>

<?php }?>
Adding Google Charts container to the Blog Post/Page
Naturally, you can’t have a chart without a container! In your blog post or page add the following
<div id="table_div" class="chart"></div>Enqueue Our scripts
To add the JavaScript to our WordPress blog we need to officially enqueue our scripts so that they are present for the table to load. Open up functions.php and add the following and save (Don’t close yet). Please note the comments at the top.
// Enqueue Scripts for our chart

// Optional:

// 1. Limit our table to display on a single page - https://codex.wordpress.org/Function_Reference/is_page
// 2. If you are WORKING with a child theme replace all instances of get_template_directory_uri()
// with get_stylesheet_directory_uri()

function fundraising_chart(){
//if (is_page('page_name')){
wp_enqueue_script('chart', 'https://www.google.com/jsapi');
wp_enqueue_script('chart_main', get_template_directory_uri() . ' /js/fundraising.min.js', array('jquery'));
//}
}

// Add Javascript Action and our ajax actions that will be used in the fundraising chart script

add_action( 'wp_enqueue_scripts', 'fundraising_chart' );
The Google Visualization library is quite heavy and unnecessary to load on each individual page or post. Simply uncomment Lines 10 & 13 to only load the JavaScript on a specific page, replacing page_name with the Page ID, Page Title or Page Slug. If you are displaying your chart in a blog post replace is_page() with is_single() See is_page() and is_single() on the WP Codex for further details.
Build Table Action
With the JavaScript, files added we now need to add the following to functions.php which is the ajax action that is called from the JavaScript file.
add_action( 'wp_ajax_build_table', 'build_table' ); //admin
add_action('wp_ajax_nopriv_build_table', 'build_table'); //frontend

function build_table() {

    //Our json file in data folder
    $url = get_template_directory_uri() .'/data/donations.json';

    //Retrieve json file
    $request =   wp_remote_post($url);

    // Get the body of the response
    $response = wp_remote_retrieve_body( $request );

    echo $response;
    die();

}
?>
Fundraising.js
When your page or post loads the action build_table is fired in functions.php. If successful it will load the contents of the JSON file and add them to the row.
var $j = jQuery;

// Load the Visualization API and the piechart package.

google.load("visualization", "1", { packages: ["table"] });

// Set a callback to run when the Google Visualization API is loaded.
google.setOnLoadCallback(drawTable);

function drawTable() {
  $j.ajax({
    url: ajaxurl,
    data: {
      action: "build_table", //this is the function called in functions.php
    },
    dataType: "json",
    success: function (json) {
      var data = new google.visualization.DataTable();
      data.addColumn("string", "Name");
      data.addColumn("string", "Type");
      data.addColumn("number", "Amount");

      //loop through json and add rows of content
      for (var x in json) {
        for (var i = 0; i < json[x].length; i++) {
          data.addRow([json[x][i].name, x, json[x][i].amount]);
        }
      }

      var options = {
        sortColumn: 2,
        sortAscending: false,
        allowHtml: true,
        pageSize: 10,
        page: "enable",
      };
      var formatter = new google.visualization.NumberFormat({
        prefix: "u00A3",
      });
      formatter.format(data, 2);
      var table = new google.visualization.Table(
        document.getElementById("table_div"),
      );
      table.draw(data, options);
    },
  });
}
// The following will resize the table in the browser
$j(window).resize(function () {
  drawTable();
});
Add a little CSS spice
Open up your theme’s stylesheet and add the following to make your table responsive.
.chart {
width: 100%;
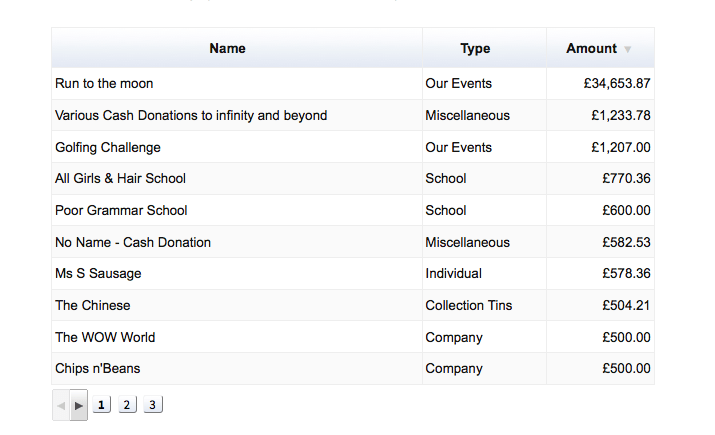
}Conclusion
If you have followed all steps correctly you should now have a fully functioning Google Chart table. If you have any problems with the code or don’t quite understand something please feel free to get in touch.